The market leaves clues, so learn where to look
There are thousands of stocks in the market and hundreds making some kind of move at any given time. The problem is deciding which ones deserve your attention and which ones are worth a miss.
The Perfect Charts is a quarterly print report built around the stocks and charts worth taking a closer look at. Each issue brings together selected trending stocks, recent price and volume action, annotated charts, notes and observations, plus questions designed to make you think about your own decisions.
No endless stream of alerts or endless amounts of data – each issue narrows the market down to the charts worth spending time on, printed in a format you can study properly and return to throughout the quarter.
The market is a serious treasure hunt
Everyone has access to the clues
A stock begins to move, reaches a new high and then pulls back. From there, you watch what happens next: how the volume behaves, whether the stock regains ground and what happens when it approaches that previous high again.
What does that tell you? Not much.
This is where stock chart analysis becomes useful.
Charts do not predict what will happen next, and that isn’t their job. They show you what a stock is actually doing at that point in time.
Is it continuing to rise? Is it reacting after an uptrend? Is it consolidating, finding support or simply going nowhere? As the price moves, the clues change with it.
Learning how to read stock market charts means learning to observe those clues, make sense of what you see and decide what, if anything, you do next.
A stock moving up isn’t necessarily enough reason to act. You might watch the initial move, see how it reacts and wait for the next clue before making a decision.
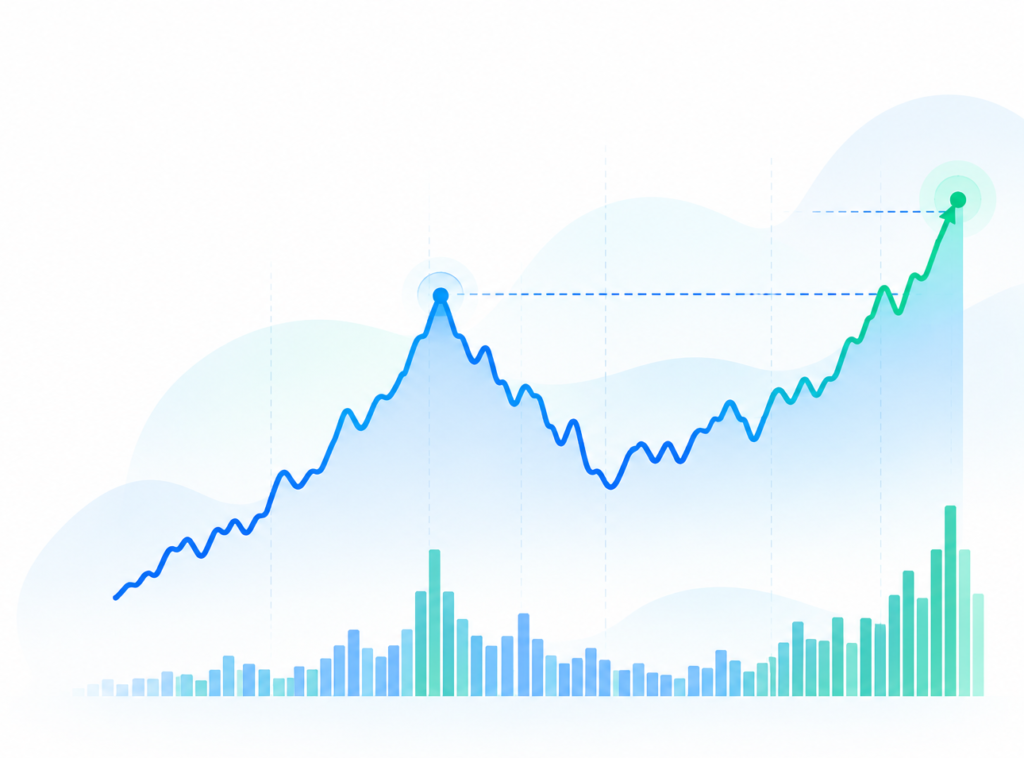
Hundreds of charts, turned into a much shorter list worth your attention
You can find stock screeners everywhere with a couple of clicks.
Run enough screens and you will probably find many of the same momentum stocks that other traders are watching. Finding the name is only the beginning.
The Perfect Charts focuses on stocks that have demonstrated a trend and price/volume action that makes them interesting to follow.
Selections can include:
- Stocks that have begun trending over the most recent weeks
- The best tradable charts from the previous 13 weeks
- The best tradable charts from the previous 26 weeks
- The best tradable charts from the previous 52 weeks
Some quarters will give us dozens of charts worth your time, others might only give us a few handful.
The market decides what makes the issue.
What will you find inside?
Every issue is built around the charts, with the notes and context you need to study what is happening for yourself.
Selected stock charts
A curated selection of stocks showing interesting price and volume action, from current moves to significant trends over the past 13, 26 and 52 weeks.
Notes and annotations
Markings, observations and commentary directly alongside selected charts, drawing your attention to the details worth looking at.
Stocks worth watching
See the trending stocks that have made the cut that quarter, without spending hours working through hundreds of charts yourself.
A little homework
Each issue includes simple questions that encourage you to study the charts, decide what you see and consider what you would do next.
The idea is to put the charts in front of you while helping you develop your own eye for stock analysis.
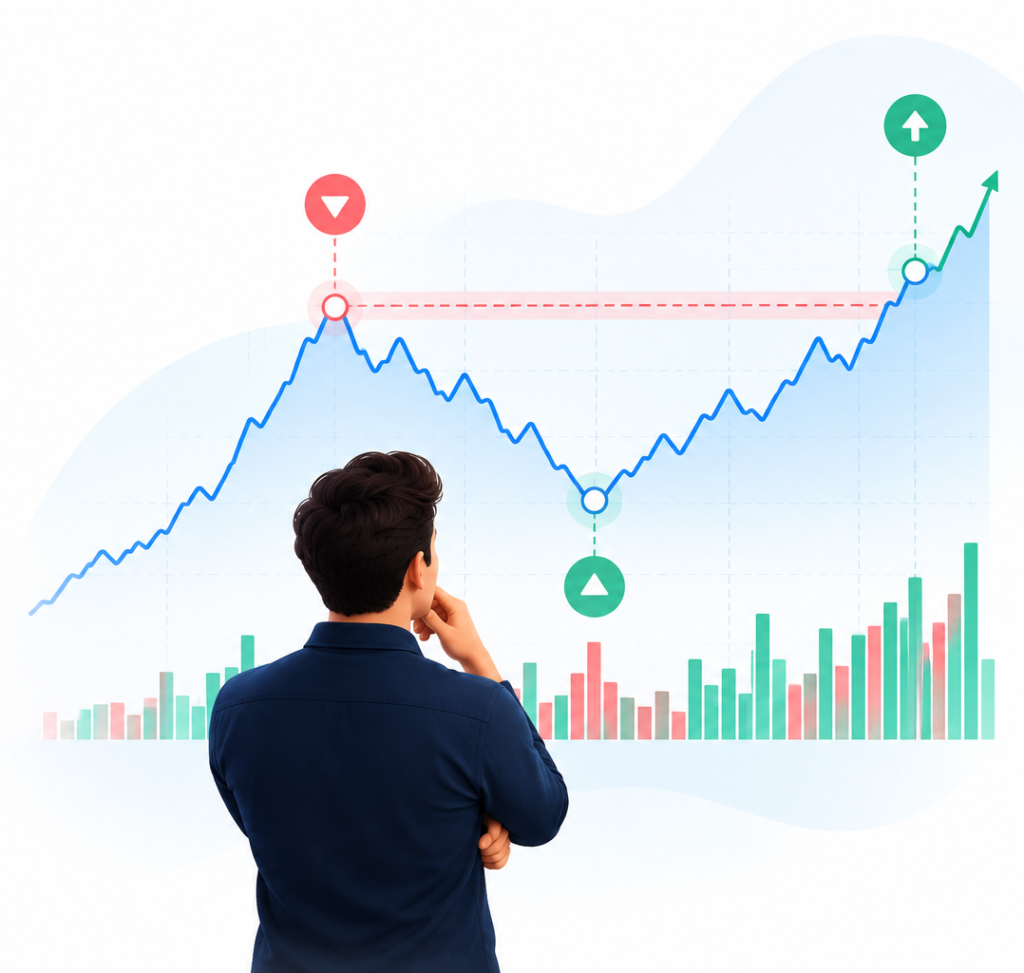
Finding the right stock is only part of the trade
You can be right about a stock and still make the wrong trade.
Where do you enter? When do you wait? How much do you commit? What does the next reaction tell you? Where do you protect yourself? Has the evidence changed?
Those decisions are important. This is also why simply producing a longer list of stock picks isn’t particularly useful. As the original notes put it, screeners can uncover many of the same stocks. The real challenge begins with how you interpret the chart and what you decide to do with that information.
The aim of The Perfect Charts is to put interesting charts in front of you and give you the space to observe first, interpret second and make your own decision third.
Train your eye
Chart reading is a skill, and skills improve through practice
This is why each issue asks you to do some of the work yourself.
Look at the chart before reading the notes. Decide what catches your eye. Ask yourself what you would do next, and why.
Over time, you may start noticing things you previously skimmed past and become more aware of your own decision-making tendencies.
The report gives you the charts, but what you see in them is where the real work begins.
Four issues in one year, no automatic renewal
Subscribe to The Perfect Charts and receive four print issues during the year, mailed quarterly.
Each issue reflects what the market has offered during that period as well as any new prospects with tradable charts, so the number of charts will vary. Your subscription will not automatically renew at the end of the year. If you want another four issues, you can make that decision for yourself.
Annual subscription: $1495 regularly
Special Introductory Offer = $995
4 quarterly print issues • Selected stock charts • Annotations & commentary • New stock picks and charts • Reader exercises
|
Subscription Option |
Shipping Details |
Regular Price |
Introductory Offer |
|---|---|---|---|
|
Single Issue
(Current Printed Issue) |
Jan-Mar Orders = Q1 issue shipped Apr-Jun Orders = Q2 issue shipped Jul-Sep Orders = Q3 issue shipped Oct-Dec Orders = Q4 issue shipped |
$600 | $495 |
|
Two Consecutive Printed Issues |
Based on order placement dates, the current issue and its subsequent issue will be shipped. | $950 | $795 |
|
Annual (Four Quarterly Printed Issues) Best Decision! |
Q1 (Early January Delivery) Q2 (Early April Delivery) Q3 (Early July Delivery) Q4 (Early October Delivery) |
$1495 | $995 |
Frequently Asked Questions (FAQs)
The report contains selected stocks and charts that have attracted attention based on their price and volume action. However, it is designed to help you observe and interpret what is happening rather than simply handing you a list of stocks to buy. Among the stocks selected, there is a very high likelihood of some of the biggest winners if market conditions are right .
No. Charts cannot tell us with certainty what will happen next. They provide clues about what a stock is doing now and how its behaviour is changing. The report is built around observation, interpretation and decision-making rather than prediction.
There is no fixed number. Some quarters may offer hundreds of interesting charts; others may offer far fewer. The contents depend on what the market is offering rather than filling the report to meet a predetermined page count.
It is intended for active traders and investors who already have some market experience and understand the value of studying price and volume action. Chart reading takes practice, and the report is designed for readers who want to continue developing that skill.
Four issues are produced each year, with issues scheduled quarterly for Q1, Q2, Q3 and Q4.
No. An annual subscription covers four issues and does not automatically renew. At the end of your subscription, the choice to continue is yours.
The Perfect Charts is provided for informational and educational purposes. Markets involve risk, and charts cannot guarantee future price movements or profitable trades. Readers remain responsible for their own investment and trading decisions.
All notes, interpretations, drawings, stock picks, commentary, exercises, homework, arrows, circles, ovals, and other presentation techniques are by Brad Koteshwar. (The raw static charts are provided by barchart.com).
Copyright © 2026 Theperfectcharts.com | Designed By XS